How Snipefinity works
Turn an idea into rules you can test.
Build investment and trading strategies for US Stocks. Describe your idea to the Strategy Assistant, inspect the rules, then test how they behave.
Daily and hourly timeframes. Invitation-only paper beta.
- 01 Define your rules
- 02 Test the idea
- 03 Try it in paper trading
01 / Define your rules
A large-cap momentum idea.
Follow one daily strategy from its rules to its historical results.
“Find large US stocks with positive momentum that are stronger than SPY. Choose up to eight by market value, and leave when their trend or relative strength weakens.”
Start with a description like this in the Strategy Assistant, or build directly in the visual Composer. Review and refine the conditions before running a test.
- Choose which stocks qualify
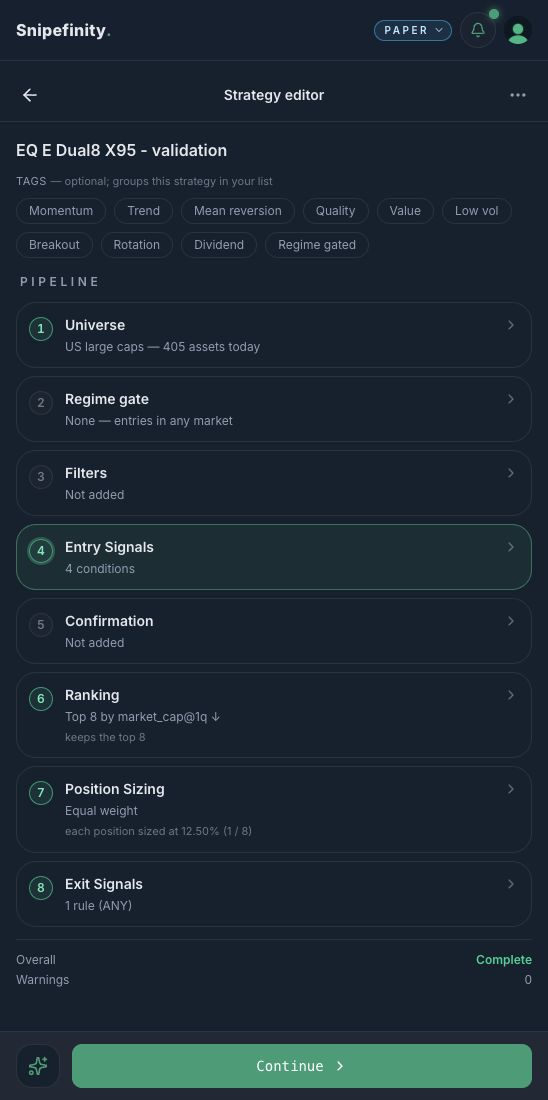
- From a Sharia-screened US large-cap universe, require a close above the 200-day simple moving average, positive 63-trading-day price growth, and stronger growth than SPY over the same period.
- Liquidity filter: today’s close × 20-day average share volume must exceed $20 million.
- Set the allocation
- Rank qualifying stocks by market value. Select up to eight, targeting 12.5% for each new position, subject to available cash and liquidity limits.
- Decide when to leave
- Exit when a stock closes below its 200-day average, or its 63-day growth factor divided by SPY’s falls below 0.95. Check exits daily; rotate the target set monthly.
- A growth factor is current price ÷ price 63 trading days earlier. This exit compares those factors; it is not a 5% stop-loss.
Prices can move positions above their initial weights. Exits and new entries can occur between monthly rotations; a holding with no ranking score can be retained.
02 / Test the idea
Test the rules against SPY.
Test the rules against a benchmark, with trading costs included. This historical simulation runs from 2 January 2019 to 25 September 2026, starting with $100,000.
- Strategy total return
- +758.24%
- SPY total return
- +245.51%
- Strategy maximum drawdown
- 29.37%
After modeled trading costs
Dividend-adjusted, before costs
Largest peak-to-trough decline

Costs used: 0.05% commission + 0.10% slippage on each buy and sell, plus modeled market impact. Orders fill at the next daily bar’s open. SPY uses dividend-adjusted prices without transaction costs.
Portfolio: realized gains are reinvested. Positions still open at the end are valued at market prices. These are simulated results, not actual account performance.
Challenge the result.
Keep the trading rules fixed. Raise the costs, then start again in different periods.
What if trading costs are higher?
Same 2019–2026 dates and $100,000 starting capital. Market impact is included in both tests.
| Costs per buy or sell | Total return | Max. drawdown |
|---|---|---|
| Main example0.05% commission + 0.10% slippage | +758.24% | 29.37% |
| Higher costs0.10% commission + 0.25% slippage | +641.35% | 30.09% |
Matched SPY: +245.51% return and 33.72% maximum drawdown, before transaction costs. These cost settings test sensitivity; they are not a broker’s quoted charges.
What if you start in another period?
Each test starts fresh with $100,000. These separate checks use zero commission, 0.10% slippage per side and market impact; their costs differ from the main example.
2020–2022
2 Jan 2020–30 Dec 2022
| Metric | Strategy | SPY |
|---|---|---|
| Total return | +85.44% | +23.49% |
| Max. drawdown | 29.52% | 33.72% |
2023–2025
3 Jan 2023–31 Dec 2025
| Metric | Strategy | SPY |
|---|---|---|
| Total return | +171.37% | +86.28% |
| Max. drawdown | 26.25% | 18.76% |
The strategy had a larger drawdown than SPY in the 2023–2025 test. In the full-period commission run, annualized daily volatility was also higher: 24.75% versus 19.25%.
How to read this example
This strategy was selected after inspecting historical results. These additional periods are retrospective checks, not untouched out-of-sample tests. A favorable backtest does not establish future performance.
Historical screening is reconstructed and can use current classifications and listing information; 2019 predates the earliest trustworthy universe data. Missing historical market-cap values are treated as unknown. Data revisions and execution assumptions can change results.
Eight stocks can still share risks. In the main run, the three largest contributors accounted for 49.2% of net completed-trade profit, excluding positions still open at the end.
03 / Try it in paper trading
Watch your rules work forward.
When you choose to continue, select your strategy, set the agent’s allocation and limits, and confirm activation. The agent checks the rules on its schedule and submits simulated orders, subject to risk checks.
Follow the decisions
Inspect the agent’s decisions, orders and positions in your account as new market data arrives.
Stay in control
Pause to stop further activity; existing orders and positions remain. Stopping cancels resting orders. Closing positions is a separate action.
The current beta uses simulated trading. It does not execute real-money trades. Lower timeframes are planned.
Put your own idea to the test.
Request access to the invitation-only paper beta. We’ll email you if a place becomes available.